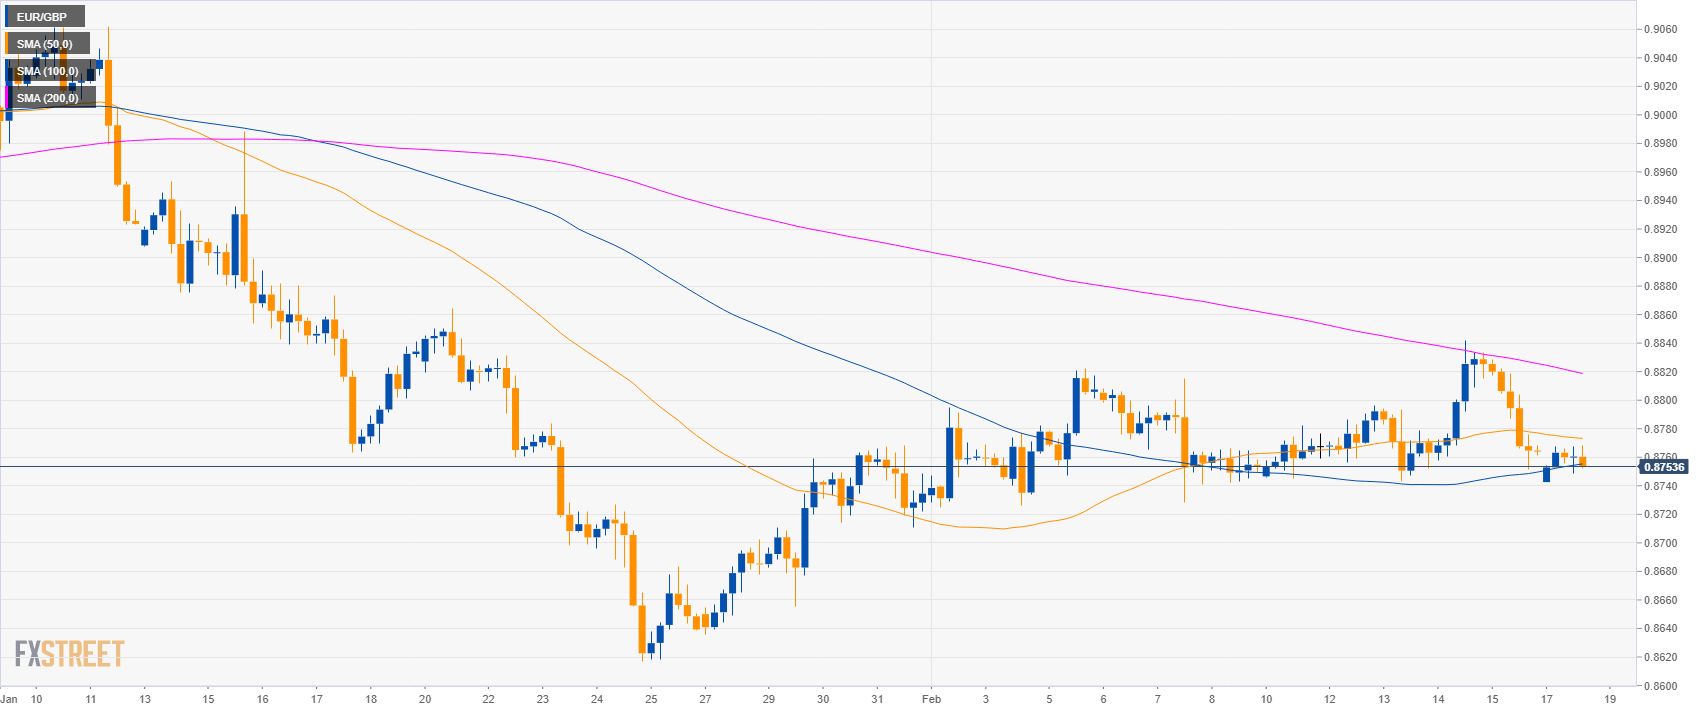
EUR/GBP daily chart: Euro sidelined near 0.8750 against Sterling
EUR/USD daily chart
- EUR/GBP is trading in a sideways trend below the 200-day simple moving averages (SMAs).
- This Monday, on US President’s Day, the financial markets might offer limited moves.

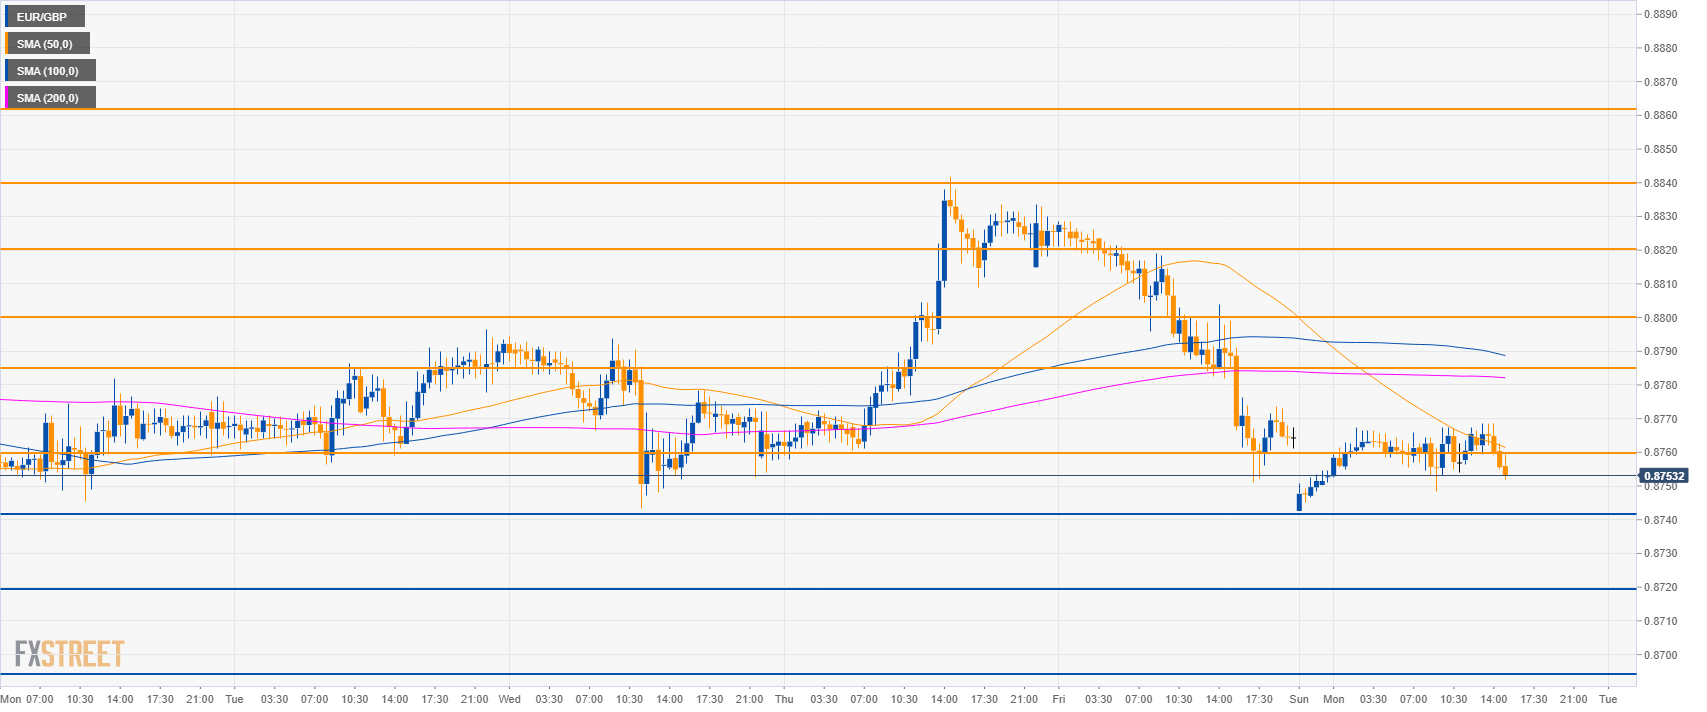
EUR/GBP 4-hour chart
- EUR/GBP is trading between the 50 and 100 SMAs on the 4-hour chart suggesting a sideways market in the medium-term.
EUR/GBP 30-minute chart
- EUR/GBP is trading below the main SMAs suggesting bearish momentum in the short-term.
- EUR/GBP is rejecting 0.8760 resistance. On the way down next supports are seen near 0.8740 and 0.8720 figure.
- Resistance is seen at 0.8760 and 0.8785 level.
Additional key levels
EUR/GBP
Overview:
Today Last Price: 0.8755
Today Daily change: -9 pips
Today Daily change %: -0.10%
Today Daily Open: 0.8764
Trends:
Daily SMA20: 0.8753
Daily SMA50: 0.8885
Daily SMA100: 0.8857
Daily SMA200: 0.8865
Levels:
Previous Daily High: 0.8834
Previous Daily Low: 0.8751
Previous Weekly High: 0.8842
Previous Weekly Low: 0.8743
Previous Monthly High: 0.9119
Previous Monthly Low: 0.8617
Daily Fibonacci 38.2%: 0.8783
Daily Fibonacci 61.8%: 0.8802
Daily Pivot Point S1: 0.8733
Daily Pivot Point S2: 0.8701
Daily Pivot Point S3: 0.865
Daily Pivot Point R1: 0.8815
Daily Pivot Point R2: 0.8865
Daily Pivot Point R3: 0.8897