Back
8 Sep 2020
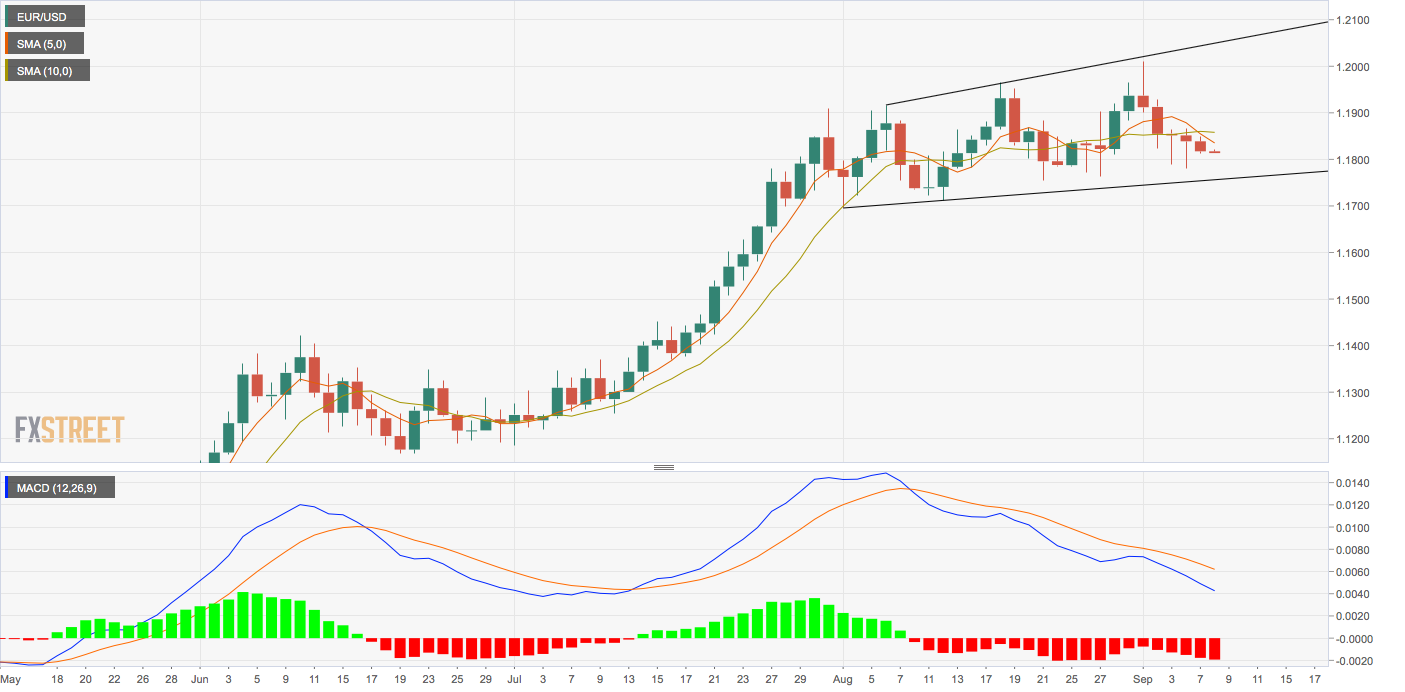
EUR/USD Price Analysis: MACD signals scope for deeper losses
- EUR/USD's daily chart MACD shows bearish momentum is gathering pace.
- The pair risks falling to key support near 1.1750.
EUR/USD is currently trading at 1.1818, down nearly 200 pips from the multi-year high of 1.2011 reached on Sept. 1.
A more profound decline to the daily chart sideways expanding channel support at 1.1752 looks likely as the MACD histogram, an indicator used to identify trend changes and trend strength, produces deeper bars below the zero line. That's the sign of the strengthening of downward momentum.
The negative crossover of the 5- and 10-day simple moving averages and Monday's bearish inside day bearish marubozu candle also indicate the path of least resistance is on the downside. The immediate bias would turn bullish above Friday's high of 1.1865.
Daily chart
Trend: Bearish
Technical levels